AI Engineering · Agents
Aloi, a Market Research Agent that Checks its Figures
Ask a chat assistant about a market and it will write numbers it never looked up. In finance, one invented figure makes the whole answer worthless.
- My role
- Solo project, built with Claude Code as the coding agent. I set the direction: terminal-first, swappable models and data sources, each user on their own Bloomberg licence.
- When
- 2026 · in progress
8 steps · about 25 seconds
Watch one question travel
A real run, recorded and annotated: what the model does, what plain code does, what the check catches, and what it misses.
› Is the US yield curve inverted right now? Show it, and keep the answer to three sentences.
● Get yield curve
✓ 11 tenors, 10Y-2Y +47 bp · 6.4s
what the model receives (excerpt)
{"as_of":"2026-10-08","curve":[ …
  {"tenor":"2Y","yield_pct":4.75, …}, … {"tenor":"10Y","yield_pct":5.22, …},
  {"tenor":"20Y","yield_pct":5.64, …}, {"tenor":"30Y","yield_pct":5.6, …}],
 "spreads":{"10Y_minus_2Y_bp":{"latest":47,"1 month ago":41,"1 year ago":55},
"10Y_minus_3M_bp":{"latest":99, …}}}No, the curve is not inverted. As of 8 October 2026 (FRED data, one day behind), the 10Y-2Y spread was +47 bp (10Y 5.22% vs 2Y 4.75%), up from +41 bp a month earlier. The 10Y-3M spread was +99 bp, and the curve has been positively sloped across all tenors since 1 month ago. The yield curve chart is shown above.
✓ 2 of 2 percentages found in the tool result. The 3 basis-point figures are bare numbers, which the check does not cover. Note added for this page: the program prints nothing when every figure passes.
Worked for 9.7s · 1 tool call(s) · 24.7K tokens in (12.0K cached) · 295 out · $0.0019
Not caught: the tool result has the 30Y at 5.60%, below the 20Y at 5.64%, so the curve is not positively sloped across all tenors.
27/28
tool-use eval questions passed, one run (95% CI 82–99%)
48 · 17
tools · playbooks
$0.002
cost of the recorded answer on Claude Haiku
3
systems with a compiled build: Windows, macOS, Linux
Approach
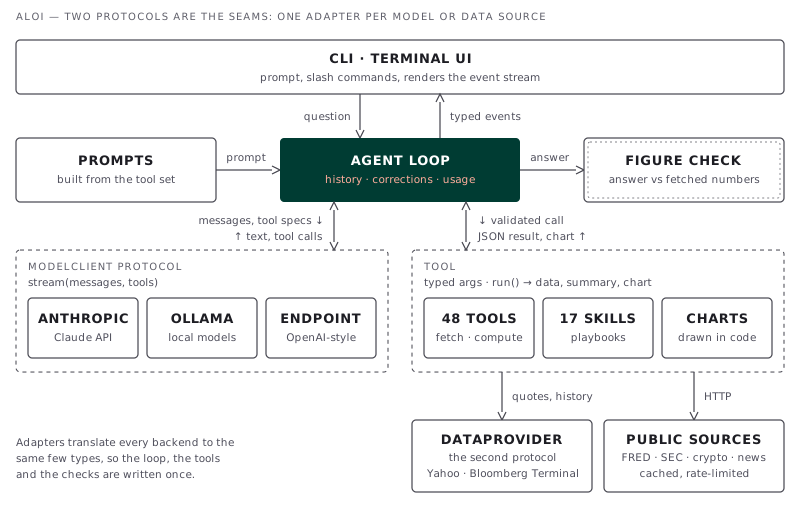
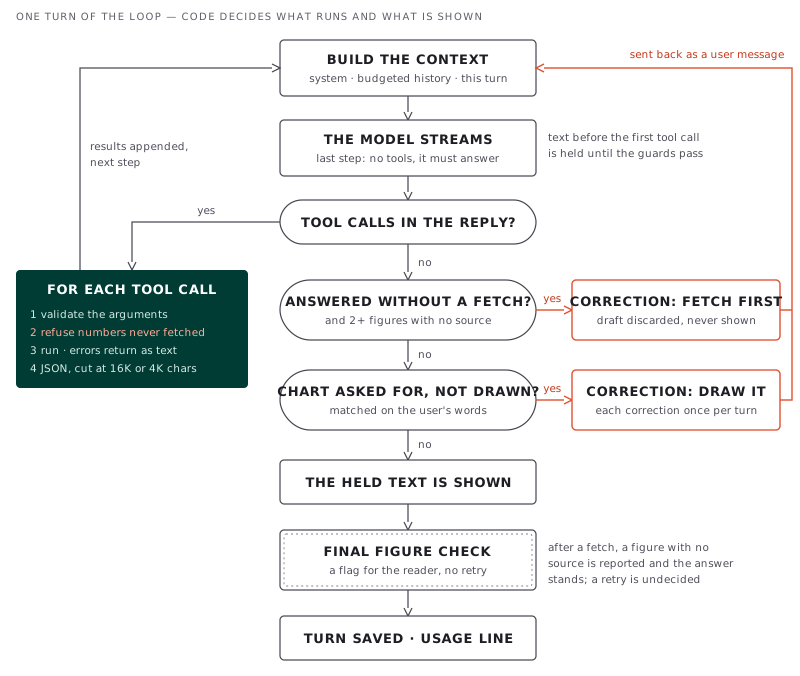
A terminal agent with a hand-written tool loop. The model only chooses and explains: fetching, arithmetic and charts are plain Python, and every amount and percentage in an answer is looked up in what the tools returned. Models and data sources are swappable.
Results
Claude Haiku passed 27 of 28 questions in my tool-use eval (95% CI 82–99%, one run): a fitting tool called, every call valid, and no figure in the answer missing from the fetched data. The one miss was a sum the model did in its head, which the check flagged as intended. The limits are real. I wrote the 28 questions myself, nobody outside has used the tool yet, and the check proves that a number was fetched, not that the sentence around it is right. The recorded run above contains one such sentence.
The figure check, step by step
- 01Collect every number the tools returned in this conversation. Dates are left out.
- 02Find each currency amount and percentage in the answer, in English or continental notation, with scale words such as bn or million.
- 03A figure passes if a fetched number rounds to it at the precision the answer used. The last digit may be off by one.
- 04Anything left over is listed under the answer in yellow. A chart is held to the same rule: every value handed to a drawing tool must have been fetched.
| The answer says | A tool returned | Result | Why |
|---|---|---|---|
| 10Y 5.22% | "yield_pct": 5.22 | passes | exact match |
| $4,880 | 4879.6 | passes | rounds to it at zero decimals |
| $1.67 trillion | 1666501944341 | passes | scale word applied |
| up 12% | no 12 anywhere | flagged | never fetched, or worked out in the model's head |
| +47 bp | "latest": 47 | blind spot | no currency or percent sign, so it is not checked |
| Nvidia at $172.40 | AMD: 172.4 | blind spot | the value exists; the check does not know whose it is |
The first and fifth rows are from the recorded run above. The others illustrate the rule.
Who holds what
Your data
With a Bloomberg Terminal, Aloi reads it through the local Desktop API on your own licence. Without one it uses Yahoo Finance. Crypto, macro series, filings and news come from public APIs.
Your model
Claude through the Anthropic API, a local model through Ollama, or any OpenAI-compatible endpoint, which is how a company points it at the model it has approved.
Your machine
There is no server of mine in the loop. One setting cuts every public source, so the program talks to the Terminal and the model and nothing else.
Not proven yet
- The eval is 28 questions I wrote myself, run once. By the standard of my own evaluation toolkit, that is a smoke test, not a result.
- Nobody outside has used it. It is a beta in preparation, not a product with users.
- The check works on values, not on meaning. A real number attached to the wrong company passes, and so does a sentence that says more than the data does.
- The free data sources are unofficial or rate-limited and can change without notice.
Next on the list: record the tool results so the eval can be replayed and run several times, and tie each figure to the instrument and date it came from.
Technical highlights
- 01Hand-written agent loop, no framework: errors go back to the model as tool results, and the last step offers no tools so it has to answer
- 02A figure check with no model in it: English and continental number formats, scale words, rounding at the precision the answer used
- 03Charts are rendered by code from Braille characters; a value handed to a drawing tool must exist in the fetched data
- 04Two protocols as seams: three model adapters (Anthropic, Ollama, any OpenAI-compatible endpoint) and two market-data providers
- 05Shipped as machine code with Nuitka and PyInstaller, built and smoke-tested on three systems in GitHub Actions
Under the hood
Stack
Related case studies
AI Engineering · Agents
AI Agents Toolkit for Index Operations
46
reusable skills across 5 agents, in daily use
AI Engineering · Developer Tools
AgentDeck, One Place to Answer Your Coding Agents
1 place
to answer Claude Code and Codex, on the PC or from a phone
AI Engineering · RAG
Index Methodology RAG Assistant
81.9%
accuracy on 94 held-out questions (95% CI 73–88%)